[EN] Sentiment analysis: Week #42

RU Version: week #42.
The analysis is based on fundamentals, blockchain indicators and statistical analysis. There is no technical chart analysis, it is only the “tone” of the crowd. As is known, the crowd is most often gone wrong, the market goes again majority. The task of current reviews is to gather as objective and versatile an assessment of market sentiment as possible.
In this review we gonna consider the following metrics:
- Well-known traders analytics. It is collected 10 cryptocurrency blogs in which each trader gives own opinion. It is not exactly the opinion of the crowd, but the traders are chosen with a wide variety of approaches and different success statistics.
- Paid Telegram channel analytics. It is collected 15 signal (or paid) channels most suitable for sentiment analysis. The authors publish their trades and analytical reviews, on the analysis of which you can understand the author’s mood and those who pay money for his signals.
- Social media sentiment. Analysis of Twitter, Telegram, Reddit, keyword searches on these social networks.
- Financing rate. This metric cannot be faked by the stock exchange, so its values are reliable and statistically pretty good working out.
- MVRV indicator. This onchain indicator tries to calculate the realized profit of large players in relation to total capitalization. It has good performance statistics with certain settings.
- Liquidations. The number of positions liquidated is a good indicator of how much price has chosen the right direction. The market is known to follow the path of least resistance.
- Fear & Greed Index. The Fear & Greed Index is based on the analysis of social media sentiment.
- Weekly poll. Telegram poll of traders ‘where the price will go first’.
It is important to understand that sentiment analysis is a medium-term analysis. The price may be in a sideways position for several weeks before executing a move.
On 23.10.2022 bitcoin price is $19,550. Since last week #41 bitcoin is up $250 (+1%).
Well-known traders analytics
This block contains 10 specialists whose projects have been selected to gather statistics on the general sentiment of traders with trading experience. These projects have existed for four years, have a consistent brand and author’s approach to market analysis. They have a large audience on their blogs.
Each trader has a different approach. Some experts look at bitcoin in terms of fundamentals and blockchain movements, someone analyzes in terms of volumetric analysis, someone work with their own customization/production indicators. The selection is therefore as diverse as possible.
The observations are based on the last week’s posts/reviews, so the data is up-to-date.
If there are no reviews from the blogger in the last week, the latest review is taken because the blogger considers the scenario to be relevant.
1. Hamaha (140,000 followers)
The author is sure that a major player was gaining bitcoin in a prolonged sideways slide. The expectation of a serious rise before the end of the year.
Quote: “I’ve got alts on my shoulders now and I want to see how it ends up, I think it’ll be good.” (in the original — “Я сейчас понабирал альты с плечами и хочу посмотреть, чем это закончится, думаю что будет неплохо”)

Conclusion: rise
2. Mr. Mozart (102,000 followers)
This week the author has not issued a review on bitcoin. The interpretation of the last review remains valid.
A consolidation below $18,500 is a strong short. Long above $23,000-$24,000. As long as the price moves in the area of $18,500-$23,000, the author perceives the movement as sideways.
Conclusion: 50/50
3. Tears of Satoshi (in the original — Слезы Сатоши) (102,000 followers)
60% deposit in crypto. Current sentiment “I am very tired of sideways, holding more than half in crypto, but ready to go down”. (in the original — “Я очень устал от боковика, держу больше половины в крипте, но к снижению готов”)
Conclusion: 50/50

4. Head of Crypto (in the original — Главный по крипте) (63,000 followers)
The author points out that the S&P 500 has formed a bottom and is ready for a reversal. On bitcoin expectations are also in favor of growth.
Conclusion: rise
5. MMarketMaker (62,000 followers)
Bitcoin has not risen above $20,000 this week, so the author has not done any reviews. The conclusion is based on all previous reviews, which are unwavering in favor of rise.
Conclusion: rise
6. Top Traders (51,000 followers)
The week before last review was on Monday evening. This week’s review is not out. The author still maintains that the first cryptocurrency will rise.
Conclusion: rise
7. Trade by Booba (48,000 followers)
The author maintains his opinion that there is a lot of fear in the market and expects a move towards $28,000-$30,000. An image was not attached to the review.
Conclusion: rise
8. Pimen (17,000 followers)
No change, the author is sticking with the rise to $22,000 and $25,000.
Conclusion: rise

9. Crypto Mentors (18,000 followers)
The author points to clear signs of a continuing bearish trend.
Conclusion: down
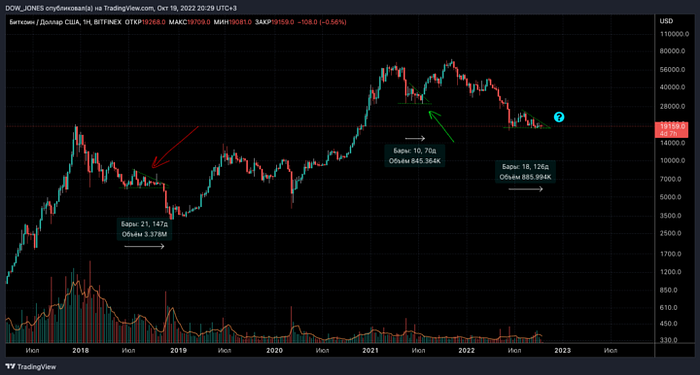
10. Dow Jones Crypto (10,000 followers)
The author is not sure where the price will come out. All that is said is that the output will be powerful.
Conclusion: 50/50
Outcome
- Hamaha — up
- Mr. Mozart — 50\50
- Tears of Satoshi (in the original — Слезы Сатоши) — 50/50
- Head of Crypto (in the original — Главный по крипте) — up
- MMarketMaker — up
- Top Traders — up
- Trade by Booba — up
- Pimen — up
- Crypto Mentors — down
- Dow Jones Crypto — 50/50
Only one in ten channels is waiting for a fall (down). The rest are either in uncertainty or in favor of rise (up). In many channels, the authors express acute fatigue and exhaustion from the sideways trend.
The large majority in favour of growth remains in place. Based on statistics from 10 traders, 75% of opinions are in favor of rise.
Paid Telegram channel analytics

In order to extend the analytics of the previous block, 15 closed (paid) VIP channels were selected and analyzed, which often go together with the public big analytics channels on Telegram and YouTube.
The purpose of this block is to examine the mood of traders, for which many market participants give up tens of thousands of dollars in total. This list includes both veteran and young channels. A public review is one thing, but how the author in a paid channel trades at a distance is quite another, and assessing the “sentiment cloud” can be very useful.
The main argument for including one channel or another in the list was the more or less adequate presentation of information. In addition to signals, it is very desirable to have at least a short overview of the market. Pampodump channels, which are containing only signals, airdrop, boxes and nft topics were excluded.
The last 7 days of posts are analyzed, focusing on the last 3 days. If the content has not been released for a long time, the most recent sentiment is retained. As this is a signalling group, the actual expectation is no further than 7 days.
The confidentiality of information from these feeds is maintained due to copyright reasons, but the authors’ overall sentiment score will be calculated.
1. BelnCrypto Premium Channel
MACD is indicating rise. The author does not have a clear understanding, but based on the short posts, more upside is expected.
2. Coin coach
During the week the trades were split like this: 15 longs and 1 short. The general mood is rise.
3. MM club
Rise is expected. But it should be understood that the author has been locked in a long of $21,000 for a month and half.
4. Crypto coin B
During the week the trades were split like this: 9 longs and 2 shorts. The general mood is rise.
5. DW Trade
BTC shorts were opened at the beginning of the week, but were closed at breakeven. In the last days the trade was only long. The general current expectation is rise.
6. Ghost trade
It is expecting of a rise to $21,000. Two long trades are opened.
7. Ark (in the original — Ковчег)
A short was closed. No new positions were opened. Conclusion: 50/50.
8. Waveform analysis (in the original — Волновой aнализ)
The expectation is up, but a short drop to $16,000 is possible. Conclusion: rise.
9. P4M
Rising above $21,000 is expected.
10. Jewtrade
Trading both ways on alts. Conclusion: 50\50.
11. Romanov
The expectation is up.
12. Trading in crypto TG
“If they wanted to go down, they would have taken it a long time ago” (in the origanal — “Если бы хотели вниз, уже давно свозили бы”) — quote. The expectation of rise.
13. Booba Signals (in the original — Booba Сигналы)
All alts traded long only, bitcoin traded long as well.
14. Aziz analytics (in the original — Азиз аналитика)
Below $19,000 there will be a search for a short entry point. At the moment the author is sticking to neutrality. Conclusion: 50\50.
15. FED RUSSIANS INSIDER
The author says it is 52% in favor of up, 48% in favor of a down. To sum up, it is 50/50.
Outcome
- BelnCrypto Premium Channel — up
- Coin coach — up
- MM club — up
- Crypto coin B — up
- DW Trade — up
- Ghost trade — up
- Ark (in the original — Ковчег) — 50/50
- Waveform analysis (in the original — Волновой aнализ) — up
- P4M — up
- Jewtrade — 50/50
- Romanov — up
- Trading in crypto TG — up
- Booba Signals (in the original — Booba Сигналы) — up
- Aziz analytics (in the original — Азиз аналитика) — 50\50
- FED RUSSIANS INSIDER — 50\50
11 traders are looking in favor of rise, 4 — uncertain. The overall situation is exactly the same as last week. The bottom line is 86% in favor of rise.
There is still no VIP group expecting a fall.
Social media sentiment
Next, social media activity related to bitcoin and the crypto market will be examined.
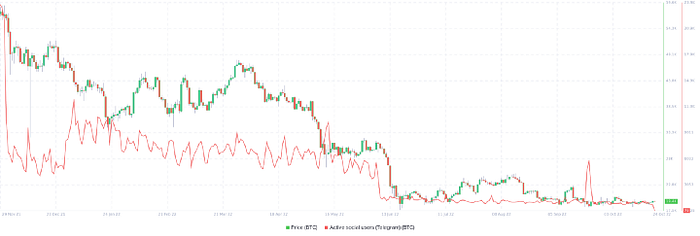
Telegram
Activity on Telegram continues to be critically low.
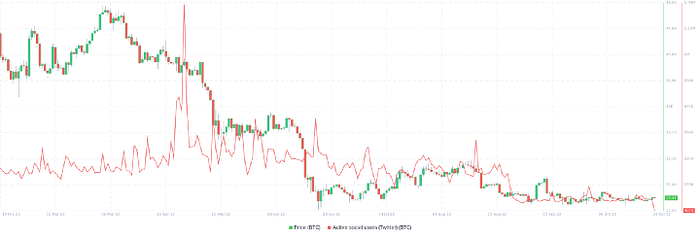
On Twitter the situation is the same, activity is still extremely low.
Keywords
Keyword searches analyse social media: Telegram, Twitter, Reddit. The pattern of reactions is different for each chart, but in the medium term these keywords may show either the culmination of a trend movement or a forthcoming future movement.
It is necessary to understand that the market moves against the crowd. When a surge of buy interest is seen, we should expect a decline, while if a sell interest is seen, we should expect a rise.
“Buy” & “dip” keywords
Logic: After a spike above a certain value, there should be a decline soon. Detailed description in week #39 (link — in russian version).
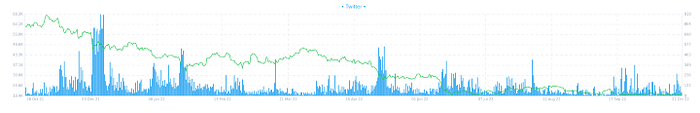
There was a surge in buying activity on 22 October.
“bear” keyword
Logic: During a spike, the decline should stop, the indicator is a “stop” indicator for the decline. Detailed description in week #39 (link — in russian version).
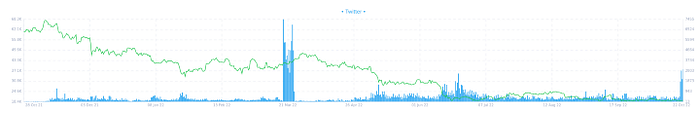
There is a serious surge in shorts sentiment, even more than after the $30,000 drop.
“short” keyword
Logic: The surge precedes the rise or during the peak of the fall. Detailed description in week #39 (link — in russian version).
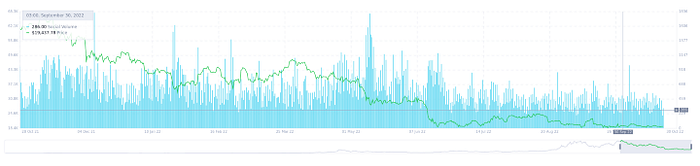
For the keyword ‘short’, no spikes were seen.
Conclusion
There was no volatility on 22 October, but still noticed buying activity and more selling activity by those wishing to sell.
Financing rate
This indicator comes from the futures markets. In simple terms, if there are too many long positions in the market (the market is most likely rising), then every 8 hours a certain percentage is taken from the total margin of each long position in the futures markets and allocated among the short positions. And vice versa. The size of these same percentages is shown on the funding rate chart. You can read more about the financing rate here (link — in english version).
How to use it?
A financing rate that is too high leads to a very rapid decline. Too low a funding rate leads to either a rise or a halt to a fall. All trend movements up or down are accompanied by a calm funding rate, it means that crowd does not favor the direction of the current movement. As soon as there is a spike, the price soon goes in the opposite direction.
A detailed statistical analysis of the metric is given in week #39 (link — in russian version).
Binance
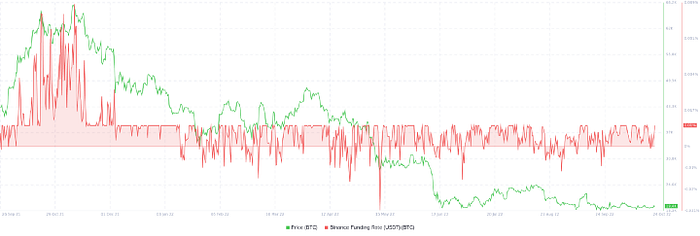
Value is positive, no seller activity noted.
Bitmex
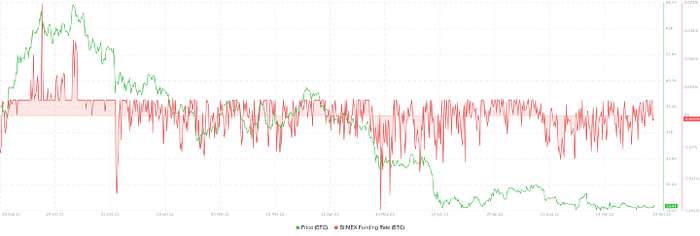
The value is balanced.
Conclusion
The financing rate does not show a significant domination of one side.
MVRV Indicator
Market Cap versus Realized Cap (MVRV) is a popular on-chain indicator that helps identify bitcoin price lows and highs. The MVRV indicator is designed to analyze long-term trends and cycles. It is used as a tool to detect two major market phases — accumulation and distribution.
MVRV is based on the idea of two types of market participants struggling — speculators and hodlers. In the context of the indicator, hodlers are investors who have given up short-term financial gains in favour of a long-term view. Speculators are traders aiming for short-term profits. The indicator helps determine which players dominate the market at a particular point in time.
Read more about this indicator here (link — in russian version).
Generally, the higher the MVRV ratio, the greater the unclaimed profits and in turn, the higher the risk that BTC holders will start selling and reducing their exposure. If the MVRV ratio is low, this could be a good time to accumulate positions.
This indicator cannot be considered very precise, as its figures can easily be distorted. The main problem with the indicator is that when you transfer for example 100,000 btc, the indicator may consider it as a buy or sell, when in fact it was a transfer from one wallet to another by one owner.
30 days ratio
See week #39 (link — in russian version) for details.

At the moment the indicator does not show an oversold market, moreover, the value is close to balance.
Conclusion
The indicator is in a balanced position, there is no oversold position.
Liquidations
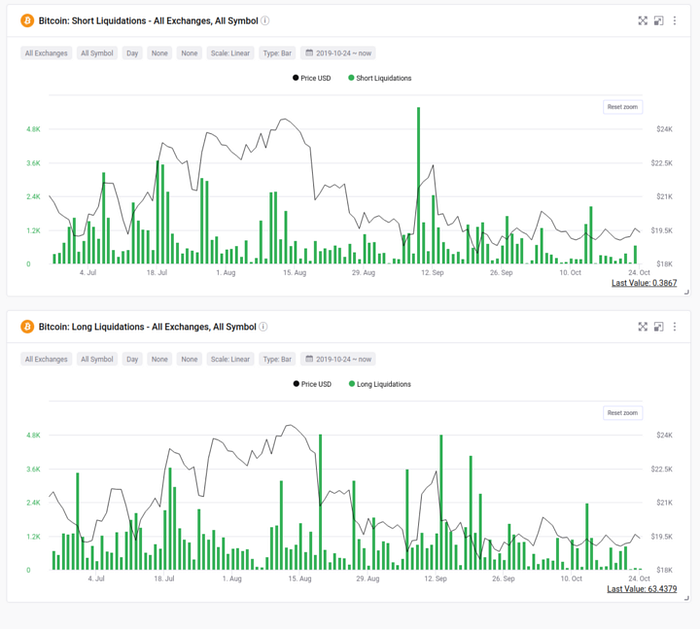
General analysis: There were 10 short liquidations and 10 long liquidations above 2.4k btc in the last three months. The total of long liquidations is slightly higher (by the number of contracts). There are also more peak bursts of long liquidations.
Local analysis: Nothing much has happened in the last week.
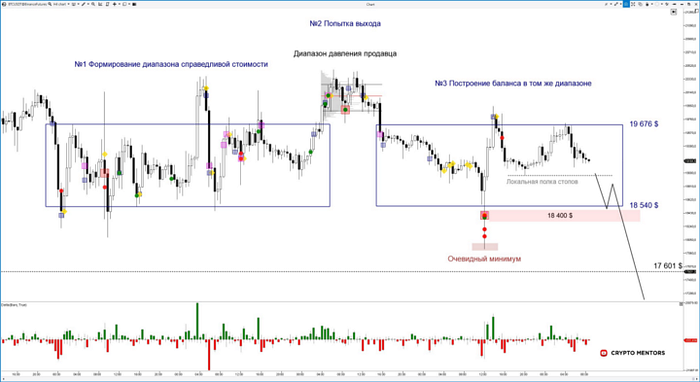
The liquidity shelf breakdown from the last week #41 review remains relevant. Liquidity has not been properly removed. On the spot market the flying lows have not been updated. Fuel for growth has not been collected.

Conclusion
Nothing happened on the liquidation chart over the past week. The general sentiment remains — more longs have been liquidated than shorts, i.e. the market is trying more longs.
Fear & Greed Index
The Fear and Greed Index shows the mood of market players by analyzing social media for keywords. The peak values of this indicator, according to the authors’ claims, signal an overbought or oversold bitcoin.
By studying the indicator we can conclude that the historical values of the market “bottom” fall within the value of 10, or that a serious bounce has been formed from this value.
Read more here (link — in russian version).
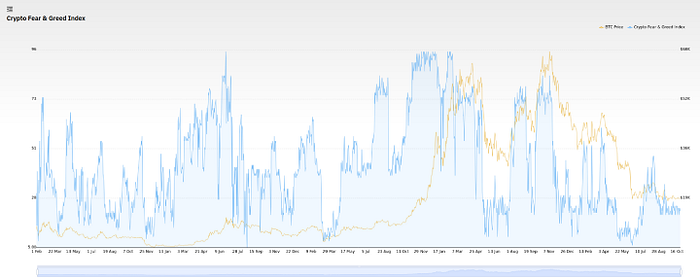
Indicator value: 22
The indicator shows a quite stable value for a bear market. With the same indicator values, the price was falling from $40,000 and from $30,000.
Conclusion
At the moment the indicator is in a fairly calm state, which is typical of a bear market. There has been no panic in the market for four months.
Weekly poll
This week’s poll results:

All sentiment review surveys:
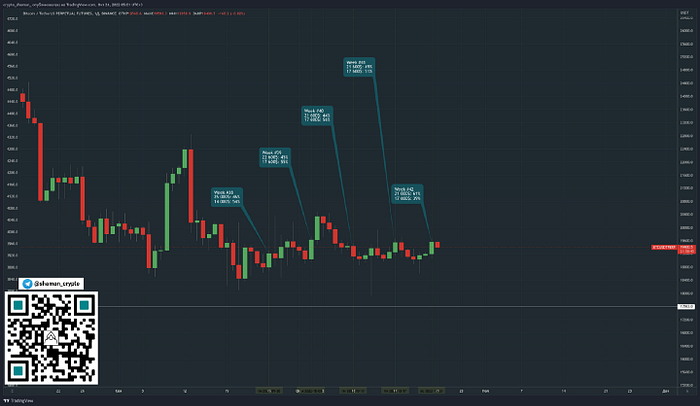
For three weeks there was still a tilt in favor of going down. But after the drop in the week before last, the upside sentiment began to rise sharply. It is worth to point out that the price has been strictly at the same level for all five weeks.
Moreover, before a significant downward move, the price took a dip, but did not fall through. It is logical to expect the same this time, considering that the dominant side is more clearly expressed.
Grand total
The public analytical channels are up 75% in favor of growth. The private VIP channels 86% in favor of growth. There is a strong tilt in favor of growth in the polls.
But there has been a serious surge in sellers on social media, despite the fact that there has also been a surge in buyers.
The other indicators show a balance.
Conclusions and author’s view
For a week in a row I have seen the same situation. Most are pushing for growth, longing, gaining alta, bitcoin, some believe that the stock market crisis is also over. And in which week I write about the sentiment in favor of further declines. There is no serious fuel for growth, you can see that in the indicators and metrics.
But! In the last week, for some reason, there has been a surge of sentiment on Twitter from those who believe in a bear market, and also seen a solid surge of those who believe in growth.
What conclusion can be drawn at this point? It is very logical to see an increase upwards as part of the takeout and then get a deep fall as part of the true move.
I have to mention that this now matches the review (link — in russian version) of 14 October. Moreover, the current review is not dragged by the ears, all measurements and sources are the same, but the data has changed. The week #41 review talked about not liking the fact that the technical review is in favour of short-term growth and fall, while the sentiment was pointing to a fall from the current marks.
If you are interested in the author’s other researches, as well as current thoughts on the crypto market, follow Crypto Shaman in Telegram.
![[EN] DWF Labs — fraud schemes, pump-and-dumps and scams](https://miro.medium.com/v2/resize:fit:679/1*maFJmwuHROBxl644TWxsXg.png)